Financial Headlines
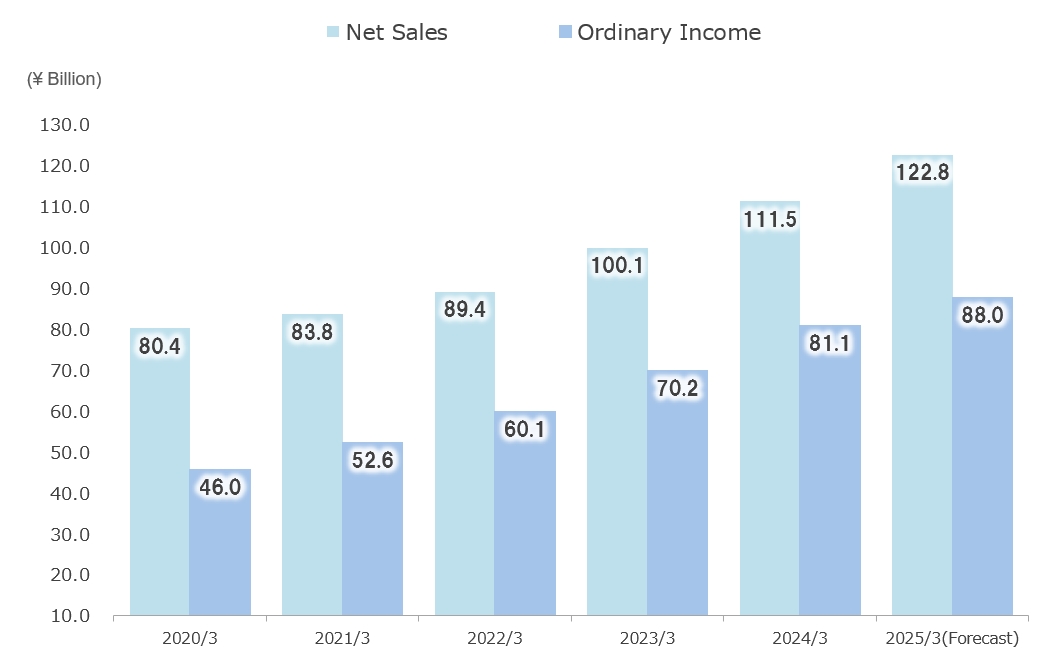
Financial Results(consolidated)
| 2022/3 | 2023/3 | 2024/3 | 2025/3 | 2026/3 | 2027/3 (Forecast) |
|
|---|---|---|---|---|---|---|
| Net Sales | 89,476 | 100,167 | 111,590 | 121,240 | 135,209 | 148,700 |
| Operating Income | 54,135 | 62,490 | 70,910 | 78,378 | 88,823 | 98,000 |
| Ordinary Income | 60,174 | 70,223 | 81,151 | 89,770 | 104,779 | 114,500 |
| Net Income | 43,500 | 50,116 | 58,007 | 64,621 | 75,191 | 82,000 |
| Net Assets | 293,567 | 327,864 | 398,692 | 433,850 | 516,011 | - |
| Total Assets | 323,927 | 366,708 | 462,165 | 500,375 | 618,796 | - |
| Capital Stock | 19,178 | 19,178 | 19,178 | 19,178 | 19,178 | 19,178 |
per Share
| Net Assets | 662.09 | 739.43 | 906.38 | 986.26 | 1,190.80 | - |
|---|---|---|---|---|---|---|
| Net Income | 97.99 | 113.02 | 130.92 | 146.90 | 171.61 | 189.23 |
Note:"Accounting Standard for Revenue Recognition" (ASBJ Statement No. 29), etc. will be applied from the beginning of the fiscal year ending March 31, 2022.
Note:On October 1, 2024, the Company conducted a 5-for-1 share split of its common shares. “Basic earnings per share” and “Basic book-value per share” are calculated assuming that the share split was conducted at the beginning of the FY2022/3-FY2024/3.
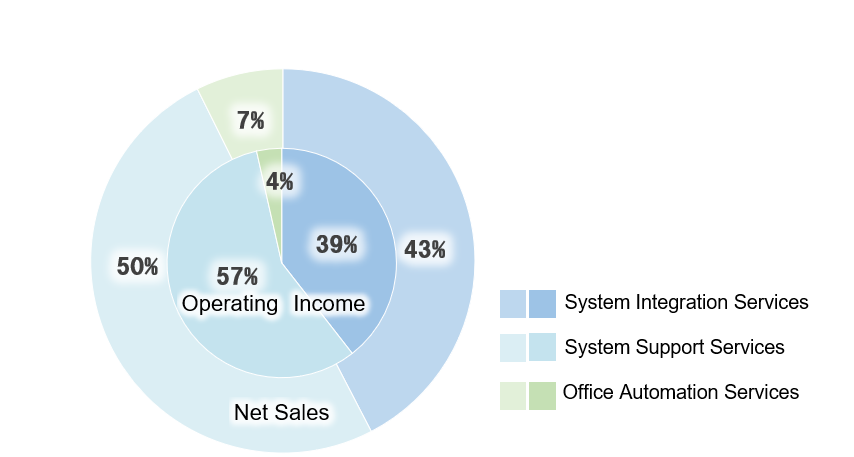
Net Sales / Operating Income by Segment (2026/3)
Financial Results(Non-consolidated)
| 2022/3 | 2023/3 | 2024/3 | 2025/3 | 2026/3 | |
|---|---|---|---|---|---|
| Net Sales | 82,616 | 93,344 | 103,401 | 113,360 | 126,761 |
| Operating Income | 52,387 | 60,725 | 68,385 | 75,744 | 85,862 |
| Ordinary Income | 56,097 | 66,512 | 75,776 | 84,038 | 98,095 |
| Net Income | 40,138 | 46,918 | 53,790 | 59,699 | 69,435 |
| Net Assets | 239,240 | 271,196 | 337,534 | 367,152 | 443,398 |
| Total Assets | 266,077 | 305,940 | 396,031 | 428,726 | 540,825 |
per Share
| Net Assets | 539.57 | 611.63 | 767.35 | 834.64 | 1,023.23 |
|---|---|---|---|---|---|
| Net Income | 90.42 | 105.81 | 121.40 | 135.72 | 158.47 |
Note:On October 1, 2024, the Company conducted a 5-for-1 share split of its common shares. “Basic book-value per share” and “Basic earnings per share” are calculated assuming that the share split was conducted at the beginning of the FY2022/3-FY2024/3.
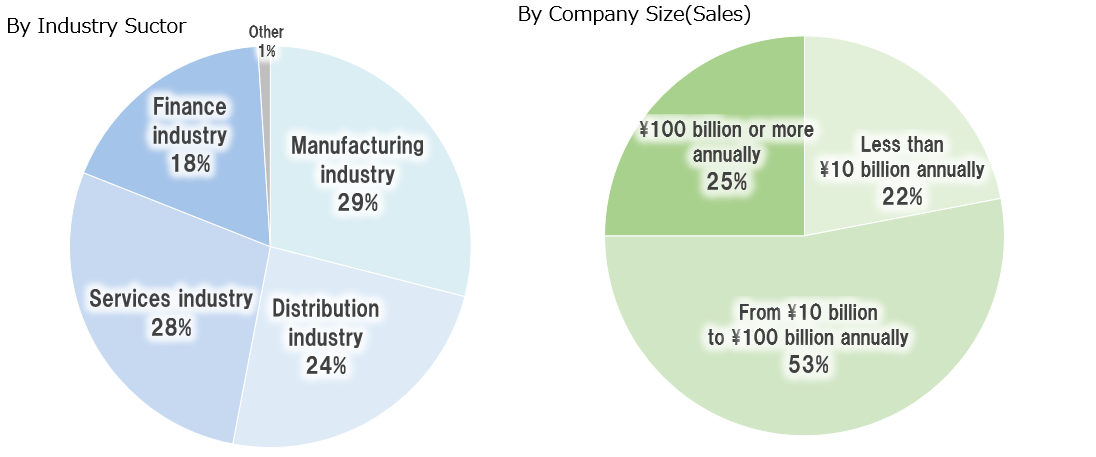
Breakdown of Sales(Non-Consolidated) (2026/3)
- *System Integration Sales Composition Ratio